Protein-Protein Interaction Network Analysis: Are More Edges Better?
Published on October 13, 2026
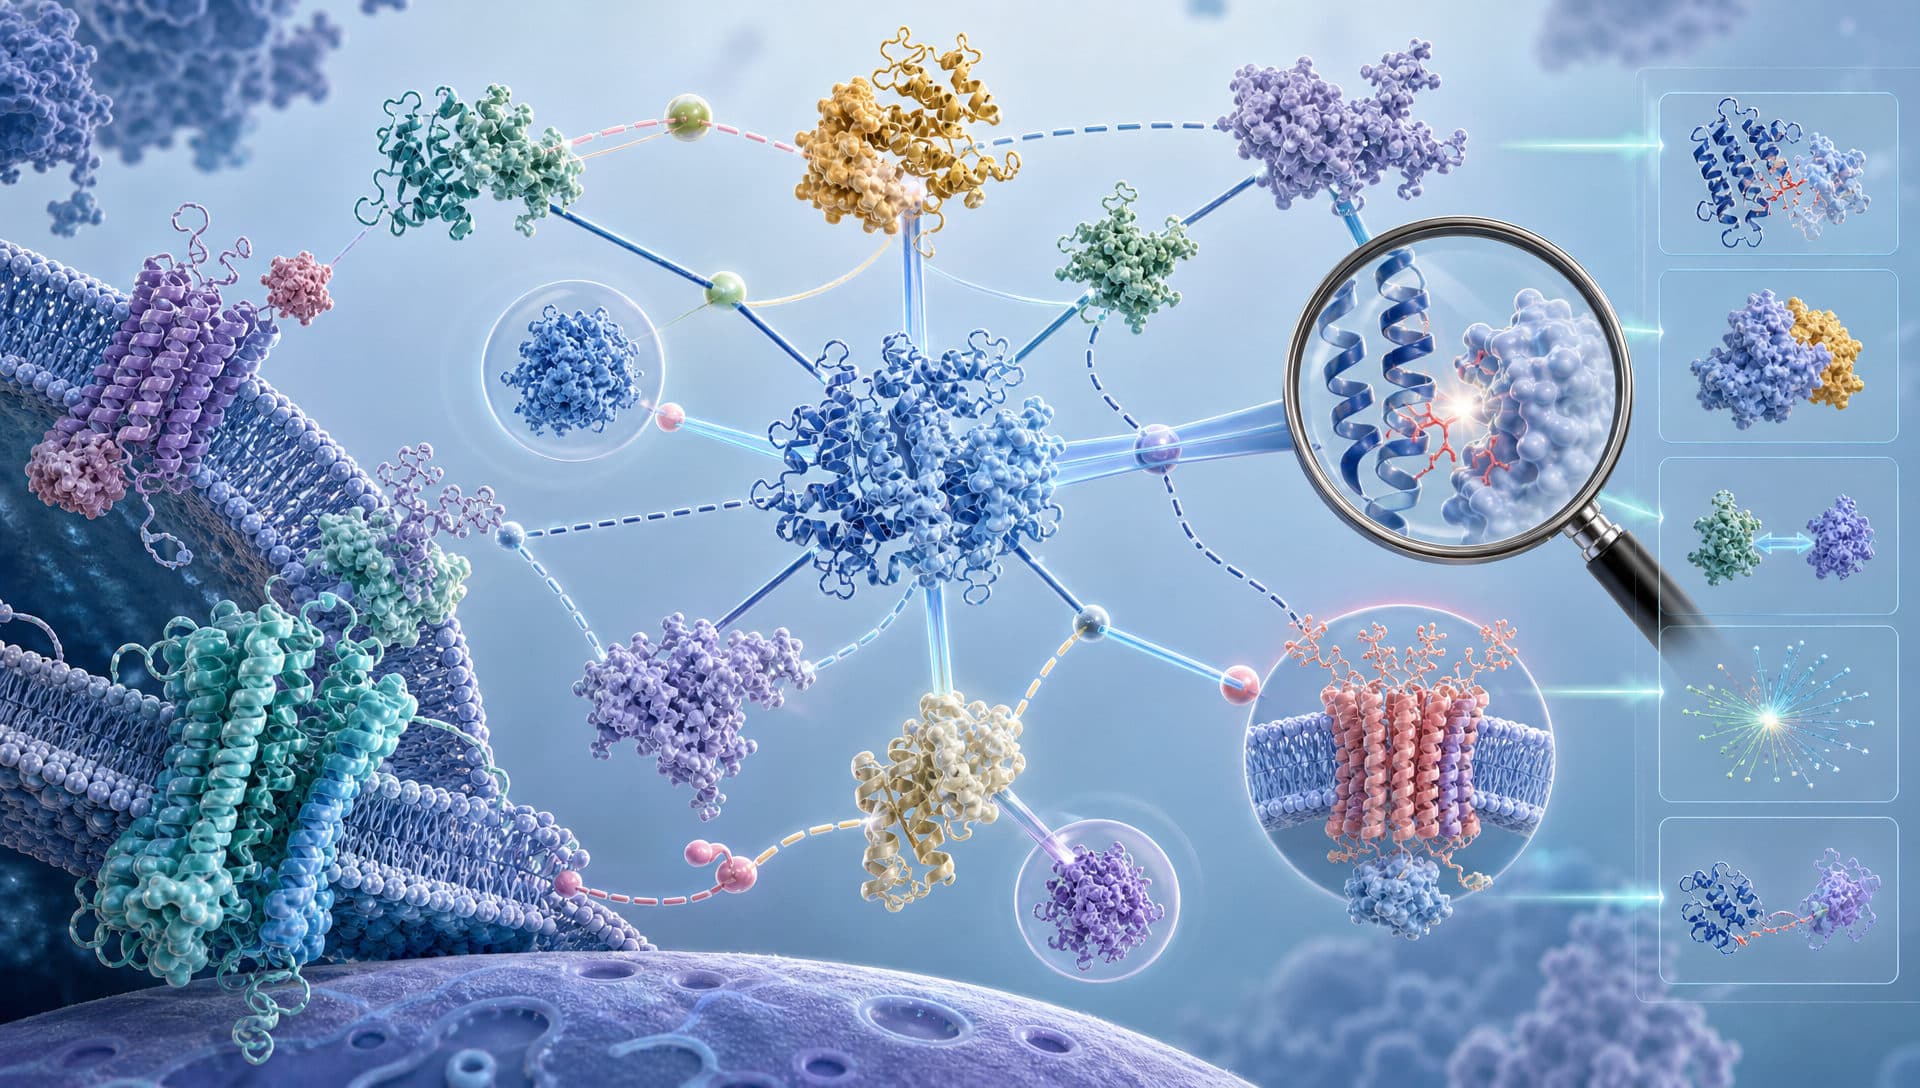
Different edge styles represent different levels of interaction evidence
Category: Computational Biology and Protein Research
Protein-protein interaction network analysis begins with edge language
Networks usually represent proteins as nodes and relationships as edges. The difficulty is that “interaction” does not always describe the same biological event. An edge may represent direct physical contact, membership in the same stable complex, coordinated behavior under related conditions, a genetic relationship, or a computationally inferred functional association.
STRING explicitly contains known and predicted protein associations, including both direct physical interactions and indirect functional relationships. Evidence can originate from genomic context, high-throughput experiments, conserved co-expression, automated text mining, and prior database knowledge. BioGRID uses experimental-system codes to distinguish direct binding, co-complex evidence, genetic interactions, and other observations. If these edges are merged without interpretation, a node with many neighbors may simply have diverse evidence—not direct binding to every connected protein.
The first task in protein-protein interaction network analysis is therefore edge classification rather than centrality calculation. Is the relationship physical or functional, experimental or predicted, direct or indirect? Is its species, tissue, cellular compartment, and treatment context known? A node becomes interpretable only after its edges are understood.
Evidence volume cannot replace evidence quality
The same reported relationship may be supported by affinity capture, mass spectrometry, two-hybrid assays, co-crystal structures, proximity labeling, or another experimental system. These methods observe different phenomena and distance scales. An atomic structure may reveal a direct interface, while affinity capture more often supports co-occurrence in a complex. Proximity does not necessarily prove direct contact. Tag position, expression level, cellular environment, and assay design can all affect the result.
BioGRID’s official documentation makes an important boundary explicit: the database curates reported experimental findings but does not guarantee that every individual interaction is true, well established, or representative of current consensus. Its value lies in retaining evidence codes and publication provenance so that users can combine orthogonal observations and judge confidence and physiological relevance.
A practical evidence layer labels direct database or experimental observations as Measured, computational associations as Predicted, and edges with insufficient context as Unknown. These labels do not rate a database. They prevent a predicted association and a directly observed interface from receiving the same visual and interpretive weight.

Identify evidence type before comparing confidence
Why degree alone does not define a key protein
Degree counts a node’s neighbors. Bridge position asks whether a node connects otherwise separate modules. Module analysis looks for groups with denser internal relationships. These graph properties can narrow a candidate list, but each depends on how the network was assembled.
Frequently studied proteins tend to accumulate more public records. Adding predicted neighbors can inflate connection counts. Combining tissues and conditions can create a global network containing relationships that never occur simultaneously in a real cell. A highly connected node may indeed be a regulator, but it may also reflect publication density, assay detectability, or database-integration choices.
Defensible protein-protein interaction network analysis places topology beside at least three kinds of biological context: expression or abundance in the relevant sample, compatible cellular localization, and evidence that applies to the study condition. When the question concerns direct binding, researchers should also examine structural interfaces, residues, and complex conformations rather than allowing a two-dimensional graph to stand in for molecular mechanism.
Convert network modules into testable hypotheses
The greatest value of a network is not the selection of one “winning” protein. It is the discovery of coordinated modules, disrupted bridges, and new relationships that can be tested. A module supported by coherent function, condition-relevant expression, and orthogonal interaction evidence is more actionable than a cluster created only by edge density.
A clear workflow can proceed in six stages:
1. Normalize protein identifiers, species, and isoforms while recording unmapped entries.
2. Separate physical interactions, functional associations, genetic interactions, and predictions.
3. Choose evidence thresholds appropriate to the research question and record why edges were filtered.
4. Identify modules, bridge nodes, and context-specific candidates.
5. Return to the experimental system, cellular compartment, and primary evidence for each critical edge.
6. Design structural, localization, binding, or functional validation.
The output is not a static verdict. It is a prioritized set of hypotheses with explicit evidence gaps. The network supports navigation; experiments determine whether an edge remains in the model.
How MatwingsVenus®(protein design agent) organizes the interaction evidence chain
The publicly described capabilities of MatwingsVenus®(晓鹜®) include intelligent dialogue, database retrieval, protein-sequence analysis, structure prediction, and protein-function prediction. Its database-query scope includes resources such as STRING, BioGRID, UniProt, and PDB, making it suitable for organizing the tasks that occur before and after protein-protein interaction network analysis.
Starting with a protein list, the platform can help normalize identity, retrieve existing interaction records, and distinguish Measured, Predicted, and Unknown evidence. Researchers can then route prioritized nodes to structural, functional, localization, or known-complex checks. Compute-intensive steps such as structure prediction remain subject to human-in-the-loop (HITL) confirmation so that inputs and expected outputs are fixed before execution.
The product value is not an automatic claim that an interaction or causal network has been proven. It is the reduction of database switching, mixed evidence levels, and disconnected tasks. MatwingsVenus®(晓鹜®) helps keep three questions in the same research context: Where did this edge come from? Why is it being prioritized? What validation is still missing?

Network candidates become credible only through targeted validation
A useful network keeps uncertainty visible
Showing only high-scoring edges can hide sensitivity to confidence thresholds. Expanding every possible neighbor can make the graph impossible to interpret. A more transparent presentation separates a core network, a candidate extension layer, and an unresolved layer, with explicit evidence rules for each. This preserves actionability without erasing alternative explanations.
A decision-ready protein-protein interaction network analysis should answer four questions. Are edge definitions explicit? Are experimental and predicted relationships separated? Are key nodes interpreted in their biological context? Does every network conclusion point to a feasible next validation step? If one answer is missing, a polished graph may still hide uncertainty behind its connections.
Turn the network into a validation roadmap
High-quality protein-protein interaction network analysis does not aim for the largest node count or the densest image. It organizes heterogeneous relationships into a traceable, filterable, and testable research map. Direct binding, co-complex membership, functional association, and genetic interaction are all useful, but their evidence context must remain visible if topology is not to be mistaken for mechanism.
MatwingsVenus®(晓鹜®) provides a conversational entry point connecting database evidence, protein identity, structural review, and functional checks before prioritized candidates move to researcher confirmation and experimental testing. When every important edge can answer “What supports it, when does it apply, and how should it be tested?”, the network becomes a practical research asset rather than a decorative graph.