Protein Structure Visualization: Which View Answers Your Question?
Published on October 9, 2026
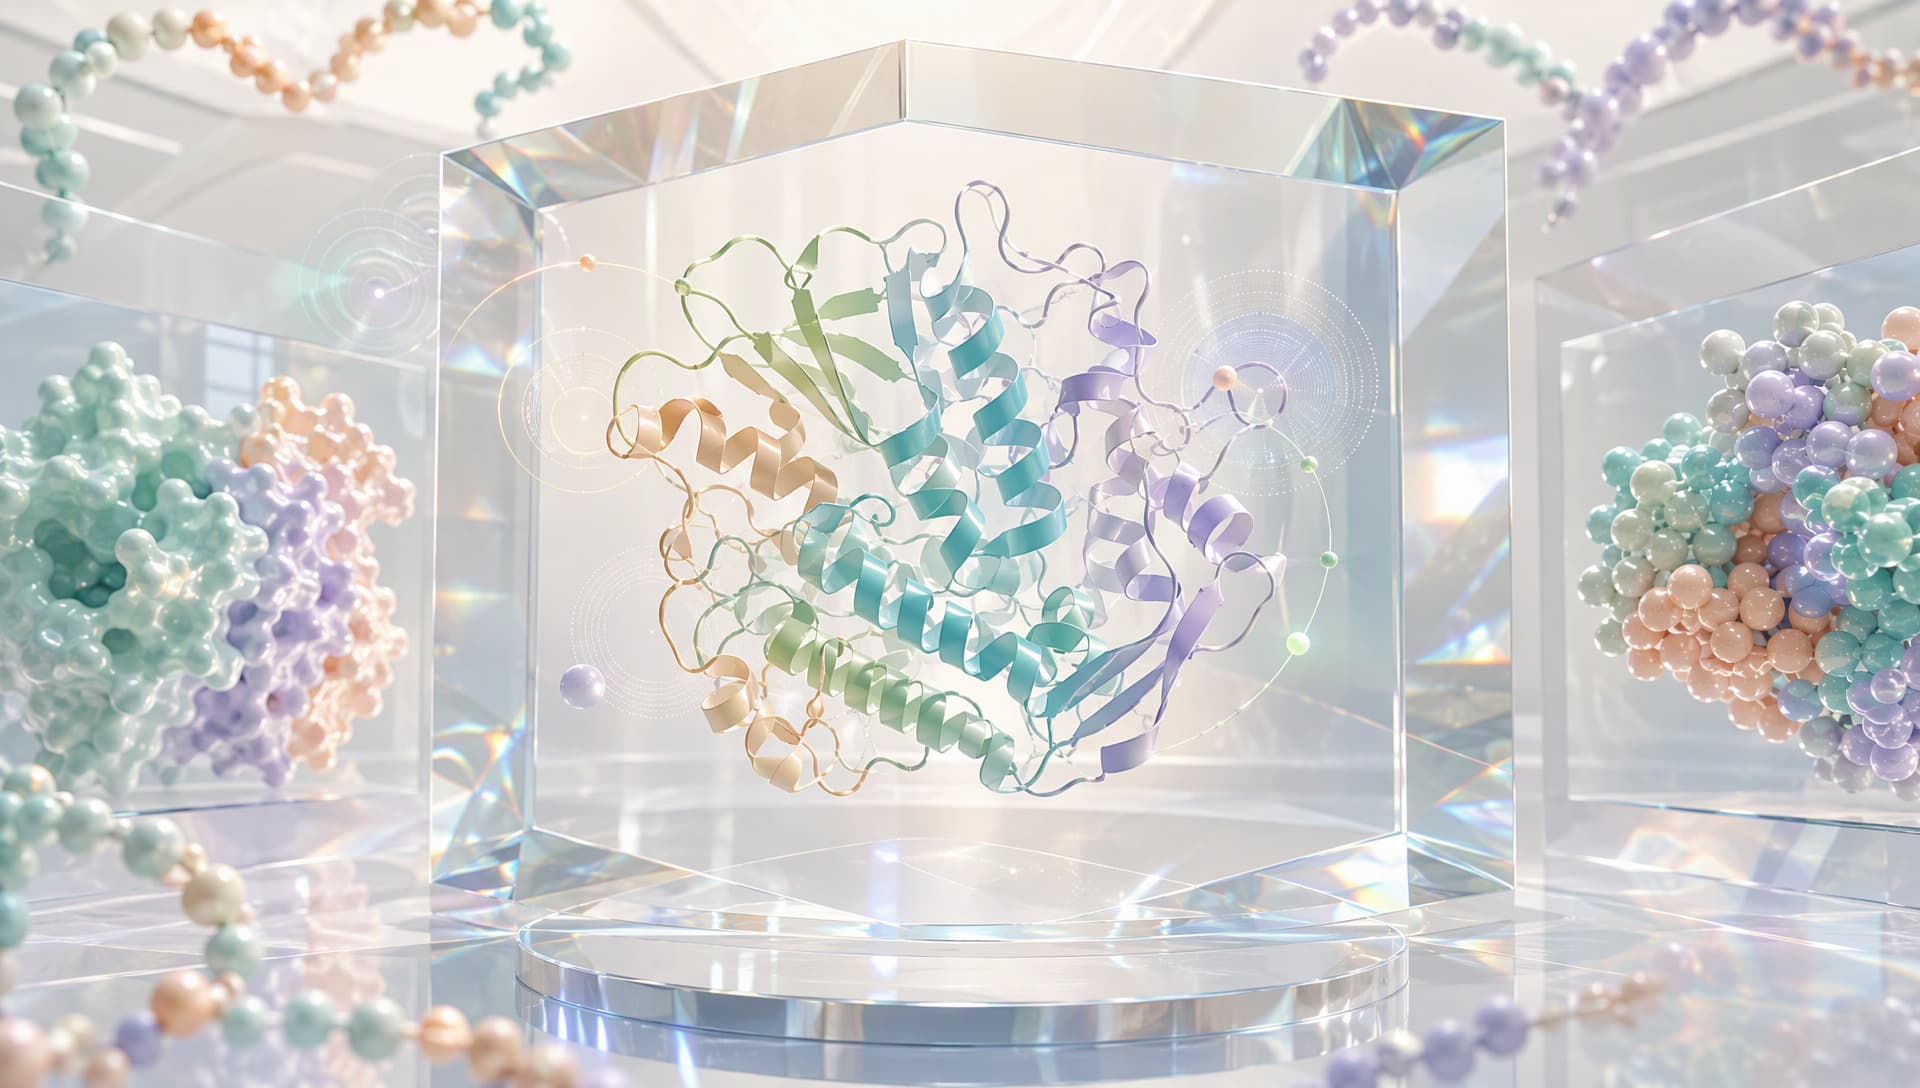
Different visual languages help readers recognize the structural message
Why protein structure visualization should not begin with decoration
A beautiful image can still lack an information target. When rainbow coloring, complex lighting, and dense atomic detail compete for attention, the reader may not know where to look. Effective protein structure visualization aligns visual hierarchy with the scientific question. A global fold needs a quiet overview. Pocket chemistry needs selected side chains, a ligand, and perhaps relevant waters. A complex interface needs clear chain boundaries and contact regions.
A structural image is also a selective translation. Coordinate files organize information at the atom, residue, chain, and biological assembly levels, while one figure cannot display everything equally. What is hidden, emphasized, or colored changes the reader’s first interpretation. Visualization cannot recover missing coordinates, and it should not make a predicted model appear experimentally established.
This is distinct from structure quality assessment. Quality asks whether the model is trustworthy; visualization asks how trustworthy information can be seen correctly. The two depend on one another but are not interchangeable.
Write a one-sentence visual brief before opening a 3D view
Begin by completing the sentence: “This figure should help this audience understand…” Possible briefs include:
• how two domains are connected;
• where a mutation sits relative to catalytic residues;
• how a pocket changes between ligand states;
• which chains perform different roles in an assembly.
The brief determines the representation. Cartoon or ribbon views clarify overall architecture. Ball-and-stick views reveal hydrogen bonds, salt bridges, and ligand contacts. Molecular surfaces show pocket openings, interface complementarity, and solvent-accessible boundaries. Assembly questions require the relevant biological assembly with chains clearly distinguished.
A frequent mistake in protein structure visualization is choosing a familiar rendering style first and forcing the question into it. Reversing that order usually communicates more with fewer elements.
Five representations, five different responsibilities
Cartoon representation suppresses atomic detail to reveal helices, sheets, loops, and domain paths. It is an effective overview but cannot, by itself, establish atomic contacts.
Ball-and-stick representation displays atoms and bonds. It works best for focused views of key residues, ligands, metals, and interaction networks. Applied to an entire large protein, it quickly becomes visual noise.
Space-filling representation approximates occupied atomic volume and helps explain steric restriction or dense packing. Its physical presence is useful, but it can obscure internal architecture.
Molecular surfaces direct attention to pockets, channels, and molecular boundaries. A surface may be colored by electrostatics, hydrophobicity, or another calculated property, but the color represents only that mapped quantity. It does not prove affinity or function.
Annotation mapping projects mutation sites, catalytic residues, conserved regions, or secondary-structure features onto a three-dimensional assembly. It links sequence and space, provided that sequence version, residue numbering, chain, and assembly are aligned correctly.

Complementary layers reveal architecture, chemistry, and functional context
Strong protein structure visualization rarely selects one representation as the universal winner. It establishes hierarchy: one layer explains the whole, another enlarges the evidence, and a restrained color system guides attention.
Color and camera choices can prevent scientific misreading
Color should classify information before it decorates it. Use stable colors to distinguish chains. Keep the main structure muted when one residue group needs emphasis. Apply a directional gradient only when displaying a continuous quantity, and state what the gradient represents. If red means acidity in one panel and risk in another, the reader loses a reliable visual grammar.
Viewpoint matters just as much. A pocket can remain hidden in a frontal view and become obvious after a small rotation. A one-sided surface cannot explain how two interfaces complement each other. A useful figure often uses two camera scales: an overview that establishes location and a close-up that answers the question.
Default visibility also requires review. Waters, ligands, ions, alternative conformations, or the biological assembly beyond the asymmetric unit may matter directly to function. Hidden by default does not mean unimportant. Check the source record before deciding what belongs in the frame.
A reusable protein structure visualization workflow
The process can be reduced to five actions:
1. Confirm the object. Align protein identity, sequence version, chain, construct, and structure source.
2. Define the question. Choose one primary goal: architecture, interface, pocket, or site.
3. Build visual layers. Select one dominant representation, then add only the required atoms, surface, or annotations.
4. Standardize the visual grammar. Fix chain colors, highlight colors, camera, background, and caption rules.
5. Run a reverse test. Ask a reader who did not make the figure what they noticed first. If the answer misses the goal, remove elements instead of adding decoration.
This workflow supports publication figures, internal reviews, candidate comparisons, and public science communication. Comparison panels should lock camera, scale, and color so that visual differences are not mistaken for structural differences.
Connecting structures, annotations, and tasks in MatwingsVenus™(晓鹜™)
The upstream step of protein structure visualization is not a rendering button; it is establishing provenance and biological context. MatwingsVenus™(晓鹜™)uses a conversational interface to organize protein database retrieval, sequence analysis, structure prediction, functional analysis, protein engineering, and de novo design so that a figure remains linked to a defined research object.

Sequence and functional context turn a structure into a scientific narrative
A defensible route is to confirm identity and retrieve available PDB records before deciding between an experimental or predicted structure. Next, organize chains, ligands, mutation sites, and functional annotations, and label information as Measured, Predicted, or Unknown. Once the visual message is clear, site analysis, mutation design, or another structural task can follow with explicit inputs and objectives.
The value of MatwingsVenus™(晓鹜™)is continuity: why the structure was selected, what the image emphasizes, and what should be validated next remain in the same task context. Rendering options, file formats, and computational tools should still be confirmed against the current platform interface, input quality, and task boundary.
Conclusion: a strong structure image makes the question simpler
Protein structure visualization is not judged by the number of colors or the shine of the model. It succeeds when a reader can locate the scientific point quickly. Cartoons explain folds, ball-and-stick views explain local chemistry, surfaces explain boundaries, annotations connect sequence to function, and color plus camera establish reading order.
When provenance, evidence level, and the visual brief remain connected, an image can support communication and decisions rather than merely decorate them. MatwingsVenus™(晓鹜™)can help link retrieval, structure, annotation, and R&D tasks so each protein structure visualization has a clear question, an explicit boundary, and a traceable next step.