
What Are KEGG Protein Pathways? How Genes Are Mapped into Biological Pathway Networks
Published on November 4, 2026
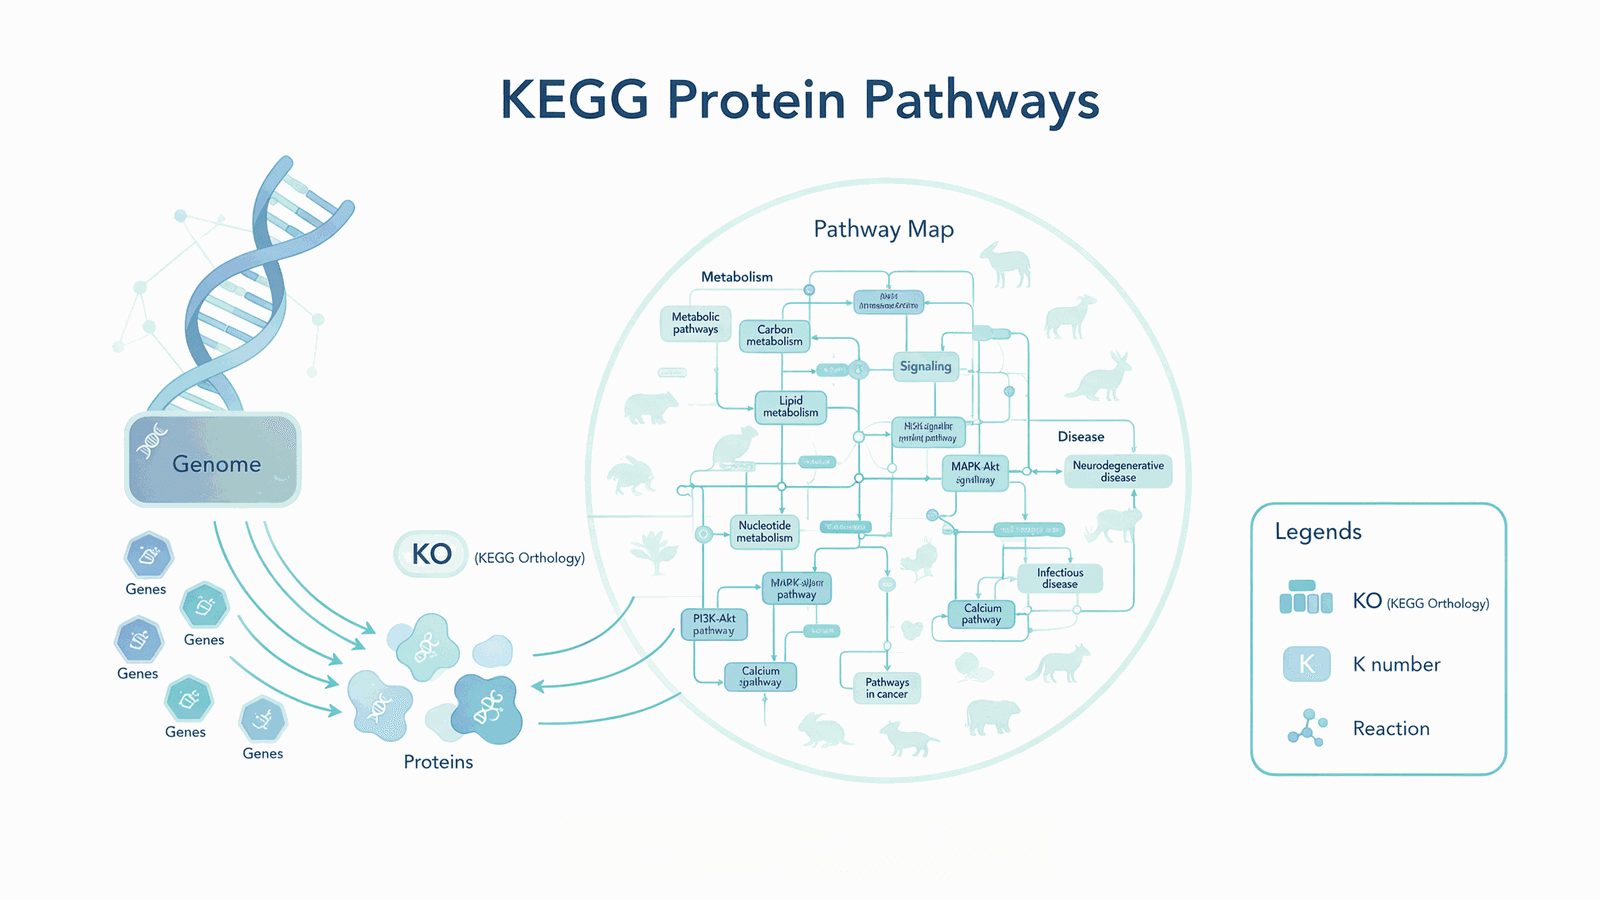
Figure 1 KEGG protein pathways: genes mapped to pathway networks via KO
KEGG (Kyoto Encyclopedia of Genes and Genomes), developed by the Kanehisa Lab at Kyoto University, is a database resource that translates molecular-level information into higher-level functions of cells, organisms and ecosystems. Its core idea is simple: map a long list of genes or proteins onto pathway maps that are readable, searchable and comparable. For countless researchers, KEGG protein pathways are the key that turns a gene list into a biological story. Whether it is target screening in pharma, functional omics analysis in academia, or enzyme function assessment in protein engineering, these pathways often offer the first useful clue.
1. Background & Mechanism: How KEGG Turns Genes into Pathways
The core of KEGG protein pathways is to map a sequencing-derived gene list onto manually drawn pathway maps, so you can read what these genes do together in the cell.
Before genomics, transcriptomics and even single-cell sequencing became routine, researchers often faced hundreds or thousands of differentially expressed genes or candidate proteins without an easy way to judge their functional clustering. KEGG's value lies in the fact that it organizes literature-verified pathways, reactions and interactions into standardized pathway maps, then uses a numbering system to "hang" the genes of any species onto these maps. Scattered gene symbols thus become pathway nodes with direction, upstream/downstream context and metabolite flow.
· Connecting dots into a network: a single gene only hints at what enzyme it might be; place it in a pathway map to see its role and position in metabolism or signaling.
· Comparable across species: the same reference pathway map can be used for human, mouse, E. coli and more, making it easy to compare conservation and differences.
· Linked to disease: KEGG also organizes disease pathways and drug targets, providing context for translational research.
In terms of content, KEGG pathway maps cover six major areas: Metabolism, Genetic Information Processing, Environmental Information Processing, Cellular Processes, Organismal Systems, and Human Diseases. This means that whether you study sugar metabolism, the cell cycle, or tumor signaling, you can find a corresponding "map" in KEGG. Think of a pathway map as a city traffic map: genes are intersections, enzymes are traffic lights, metabolites are vehicles, and the KO number is the common coordinate system that links different versions of the map.
2. Principle & Structure: Three-Layer Architecture of KO Numbers and Pathway Maps
The "translation hub" of KEGG protein pathways is the KO (KEGG Orthology) number, often called the "K number."
From genes to K numbers. Genes in a species that perform the same function are assigned the same K number. For example, human TP53 corresponds to K04451, PTEN to K01110, and CDK2 to K02206. A K number represents a "function" rather than a specific gene of a specific species, so it works across species and can be linked to EC numbers and pathways. Notably, K numbers come from two sources: experimentally characterized genes/proteins, and generalizations based on sequence similarity. When you have an unknown protein sequence, KEGG's BlastKOALA / GhostKOALA can suggest candidate K numbers from similarity, enabling automatic annotation. This is also why K numbers travel across species — when sequences are similar enough, function often matches.
From K numbers to pathway maps. The KEGG PATHWAY database contains manually drawn pathway maps, identified by a prefix + 5-digit number: `map`, `ko`, `ec` and `rn` denote reference pathways, while organism codes such as `hsa` and `mmu` denote organism-specific pathways. Examples include `hsa00010` (glycolysis/gluconeogenesis), `hsa04110` (cell cycle) and `hsa04115` (p53 signaling pathway). In each map, box nodes represent genes/enzymes, arrows represent reactions, small dots represent compounds, and reversible/irreversible status and EC numbers are annotated nearby. Here is a useful distinction: reference pathways (map/ko/ec/rn) are like "standard answers," while organism-specific pathways (e.g., hsa04115) replace the K numbers on the standard map with the specific gene IDs of that organism, showing directly whether that organism actually has these genes.

Figure 2 KO three-layer mapping: Gene → K number → Pathway Map
3. Measurement & Selection: How to Run KEGG Enrichment Analysis and Choose Tools
KEGG pathway enrichment analysis answers: among my gene set, which functional modules are significantly "enriched"?
Enrichment principles. First map the gene list to K numbers, then compare the coverage of these K numbers in each pathway against a background set to obtain a p-value and an adjusted p-value. A pathway is usually considered significantly enriched when the adjusted p-value < 0.05; common methods include Benjamini–Hochberg (BH), which controls the false discovery rate (FDR). Statistically, enrichment analysis most often uses a hypergeometric test: within a "pathway × background gene" framework, it asks whether your gene set is more concentrated in certain pathways than random draws would; the smaller the p-value, the less likely the enrichment is by chance.
· Simple pathway queries: use KEGG's official KEGG Mapper (Reconstruct, Search, Color, Join) and BlastKOALA / GhostKOALA for KO annotation and mapping.
· Enrichment statistics: use online platforms such as Enrichr (includes libraries like KEGG_2021_Human), or local tools like clusterProfiler in R/Python.
· Complete pathway maps/modules: retrieve KEGG PATHWAY and KEGG MODULE data directly.
For users without programming experience, interactive online enrichment platforms are often friendlier; for teams that need batch, reproducible analysis, a scripted R/Python workflow is recommended for version control and auditability.
4. Conditions & Workflow: From a Gene Set to Pathway Interpretation
A reproducible KEGG pathway analysis usually follows five steps.
1. Obtain the gene list: from differential expression, differential protein, or screening results.
2. ID mapping: convert gene symbols / UniProt IDs into K numbers (KO).
3. Enrichment statistics: run KEGG enrichment and read adjusted p-values and overlapping genes.
4. Pathway visualization: map results onto pathway maps and highlight key nodes. Color intensity or shape is often used to distinguish up/down-regulated genes, key enzymes and crossroad nodes, so it is clear at a glance which pathway is enriched and where the bottleneck is.
5. Biological interpretation: with experimental context, decide which pathways deserve deeper study and validation.
Using 12 genes related to p53/cell cycle (TP53, MDM2, CDKN1A, BAX, CASP3, ATM, CHEK1, CHEK2, PTEN, BBC3, CDK2, BCL2), KEGG enrichment gave the most significant hit as "p53 signaling pathway" with an adjusted p-value of about 2.2×10⁻²⁸, followed by cellular senescence, cell cycle, apoptosis and cancer pathways. This aligns closely with the gene set itself, demonstrating that the workflow is reproducible and internally consistent.
In real analyses, the most overlooked step is "ID mapping": naming across databases (gene symbols, UniProt, Entrez, Ensembl) is not always one-to-one. Wrong or missing mapping distorts downstream enrichment. So it is advisable to normalize IDs before enrichment and to keep the organism code in the results (human pathways start with `hsa`) to avoid treating mouse genes as human. The data source, library version and correction method should also be reported so that conclusions can be audited.

Figure 3 KEGG enrichment workflow: from gene set to pathway interpretation
5. With MatwingsVenus® (晓鹜®): AI-Driven Pathway Understanding & Protein Engineering
For protein engineering and drug development, KEGG pathways are not just a "backdrop" — they are the functional context for judging protein function, choosing engineering targets and assessing the impact of modifications.
On AI-driven protein engineering platforms such as MatwingsVenus® (晓鹜®), researchers can combine pathway/function annotations (such as K numbers, EC numbers and pathway membership) with sequence features and structural information for function prediction, stability assessment and directed-evolution design. For example, when a target enzyme sits at a key node in a metabolic pathway, pathway context helps estimate how engineering that enzyme might affect the whole pathway, enabling more robust mutation design and better assessment of by-products and orthogonality. Going further, whether you are altering substrate specificity, improving thermal stability, or assessing whether a mutation could affect an entire metabolic pathway, combining KEGG pathway context with protein structure and sequence features can significantly narrow the search space and raise design success. MatwingsVenus® (晓鹜®) is oriented in this direction, treating "pathway functional annotation" as one of the contexts for understanding a protein, serving function prediction and directed evolution.
FAQ
Q1: What is the difference between KEGG and GO?
KEGG focuses on pathway and reaction networks, using K numbers to map genes onto pathway maps; GO focuses on functional ontology, describing gene function via BP/MF/CC categories. Both are often used together to complement each other.
Q2: Is there one K number per gene?
Not exactly. A K number represents a "functional ortholog" module and can correspond to multiple genes across multiple species; a single gene can also participate in multiple pathways and map to multiple EC numbers.
Q3: Why use adjusted p-values in enrichment analysis?
Because hundreds or thousands of pathways are tested at once, unadjusted p-values tend to produce false positives; methods such as BH control the false discovery rate (FDR) for more reliable results.
Q4: Can I run KEGG analysis without experimental data?
Yes. As long as you provide a gene/protein list, you can run KO annotation and enrichment analysis; however, the biological meaning of conclusions still requires experimental validation.
Summary
KEGG protein pathways translate a "gene list" into a "functional network," whose core is the three-layer KO number mapping. Understanding pathway map identifiers, K numbers and enrichment statistics is key to reproducible analysis. Combining pathway context with AI-driven protein engineering is becoming a new path to faster R&D.